I will use a simple example to explain (1) how I identify an opportunity to enter the market, (2) formulate my trading plan and (3) some thoughts on strategy.
Identify OpportunityI am a big fan of using 1-2-3's and stuff to identify potential opportunities in the markets.. You may go here -
https://investdifferently.info/themarket.html - for a brief overview of my favorite "1-2-3" method.
YOU..., on the other hand are completely different and you probably have your own way of identifying opportunities. You may be looking at the RSI and say a MACD indicator to identify a likely buy / sell area. Or you may use a very simple two moving averages strategy, if the short-term MA moves above the long-term MA you buy and if it drops below the long-term MA then you sell. The method does not really matter, as long as you have SOME METHOD to identify when to buy and when to sell. As long as I have a METHOD, I can formulate a trading idea. Some will work and some not. Some signals will be great and hand us a profit, and some will not, resulting in losses. Note - SIGNALS: the method is not at fault, the signal the method generates is - some are false signals, or lasts only for a very short time.
So this is my first step - to use my favorite method to identify an opportunity to enter. For the rest of this example I will use MY TECHNIQUE - but note I am not trying to promote my technique, it is just my favorite way. I tried many different methods and this one was the easiest for me to understand and quite frankly, I don't need anything more. But note that it applies equally well to YOUR TECHNIQUE, whatever that technique might be - this is not what makes or breaks the trade, this is just used to IDENTIFY me an opportunity.
OK..., so my mentor said - "a chart is a chart is a chart" You can look at anything that we plot over time, weather patterns, orders placed on weekends at MacDonalds, or prices for crude oil - it does not matter, one chart gives us the same picture as another chart. The point is there is a "LAW of CHARTS" - a law that describes how charts works (Google it!) - and you can download that law - or send me a mail and I'll send you the law, its free. (
The law does not care about what kind of chart it is (bar or candlestick or line chart) or what that chart represents - it is not a law of markets - it is a law of charts)
I use that law, for it is a very simple law and I like the simplicity.
So here is a chart - of a crypo-currency, well not really a currency, a crypo coin, or a crypo token - just some arbitrary crypo thingy. It is a line chart, that is all that is available.
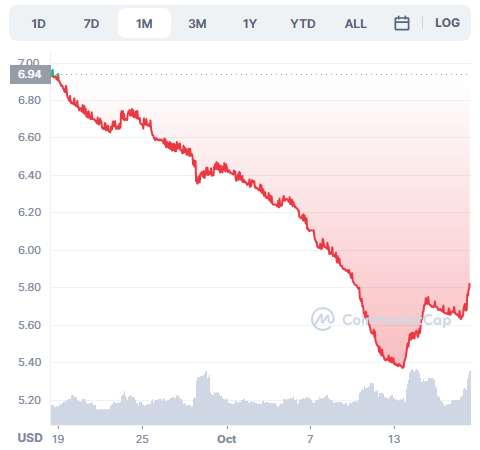
And here I applied the law of charts over it:
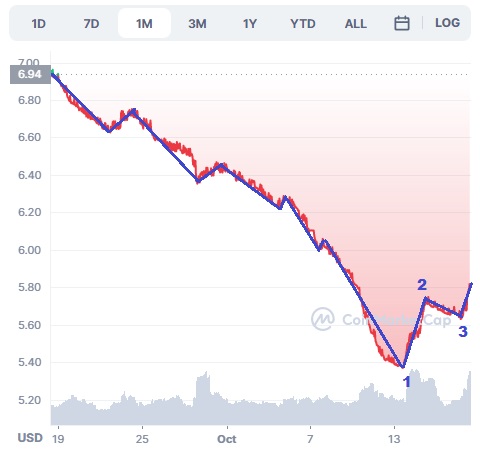
I have a 1-2-3 and a breakout above the #2 point! And that is an entry signal!!
This signal simply says - the market is most likely going up.
Will it continue to go up? I don't know
For how long will it go up? I don't know
Is this maybe a false signal? I don't know
I don't know anything else. All I know is there is a signal - by my chosen method - I don't know anything else about this signal, how strong it is, how long it will last, will it actually last; I know nothing more about it, only that it gave a signal that "maybe" it is now going up. And if you used a short-term and long-term Moving Average, maybe your method also gave you a signal - it depends on the MA's you used.
All we have here is a signal that says: "maybe the market is going up"


